
Hi, I'm Deeksha Tewari
Business Analytics MSc Student | Data Science Enthusiast | Power BI & Tableau Specialist | Python, R & SQL for Insightful Solutions
Data-Driven Insights & Analytical Thinking
MSc Business Analytics student with hands-on experience in data analysis, visualization, and predictive modeling using tools like Python, R, SQL, Power BI, and Tableau.
Background
I'm currently pursuing my MSc in Business Analytics at the University of Limerick, with a strong foundation in Python, R, Power BI, Tableau, and SQL. I’ve completed internships where I worked on exploratory data analysis, dashboarding, and predictive modeling, applying CRISP-DM and machine learning techniques to real-world data. I'm passionate about solving problems with data and communicating insights effectively.
Data Science & Analytics
Programming & Tools
Deployment & Dev Tools
Visualization & BI
Featured Projects
A selection of my work in data analytics, visualization, and machine learning — from dashboards to predictive models
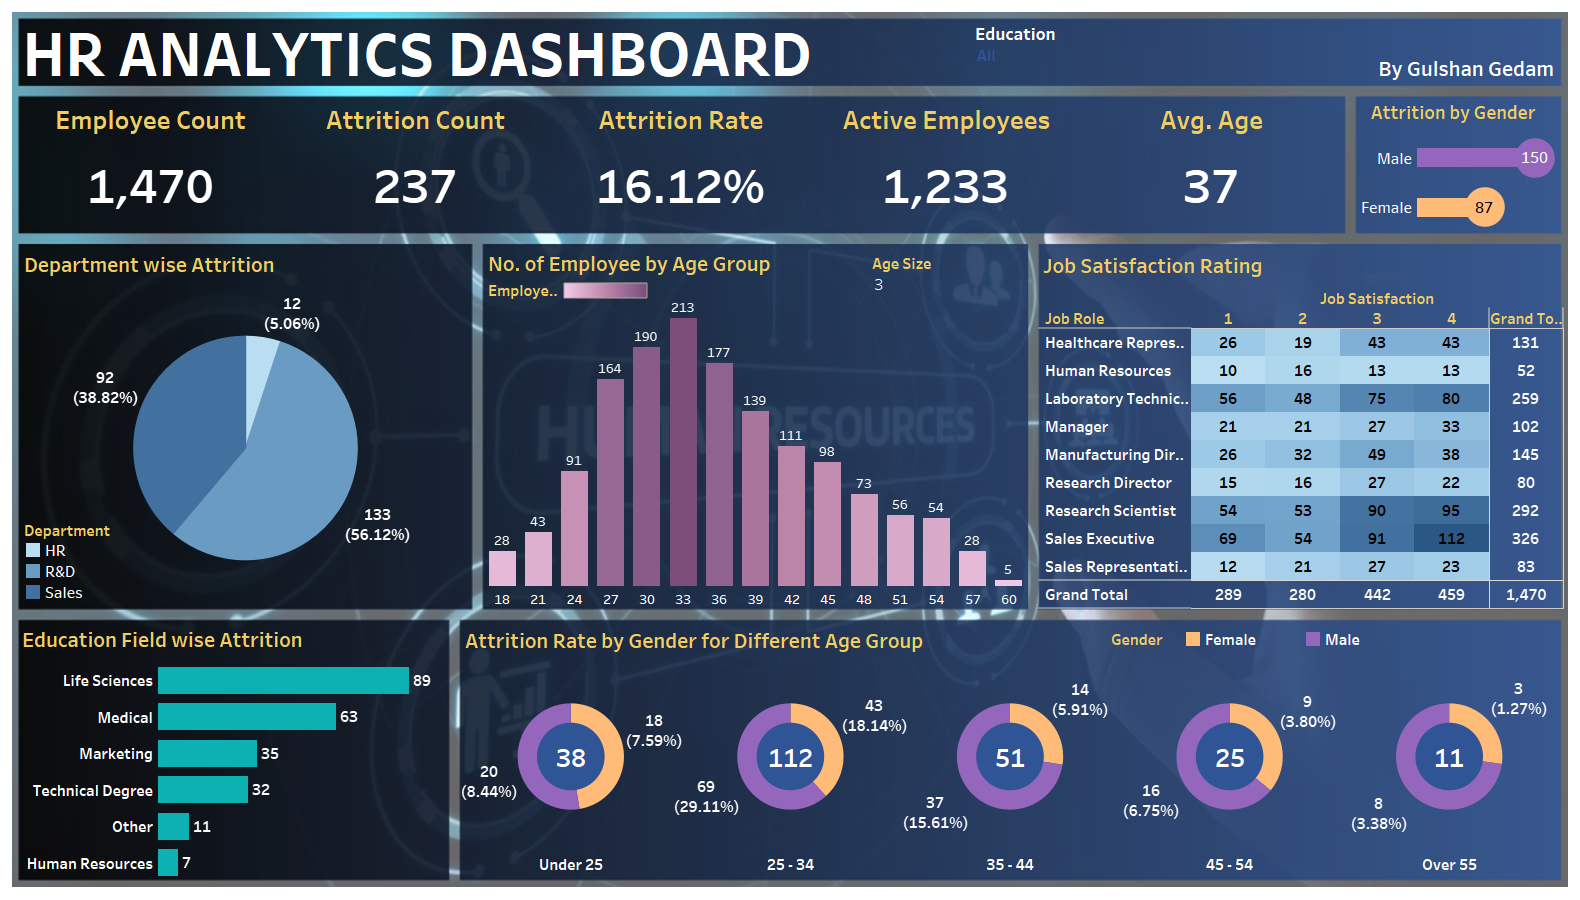
HR Analytics Dashboard
Created an interactive HR dashboard using Tableau (IBM HR dataset) to visualize attrition trends, employee demographics, and satisfaction scores. Integrated KPIs, heatmaps, and filters for actionable insight delivery to stakeholders.
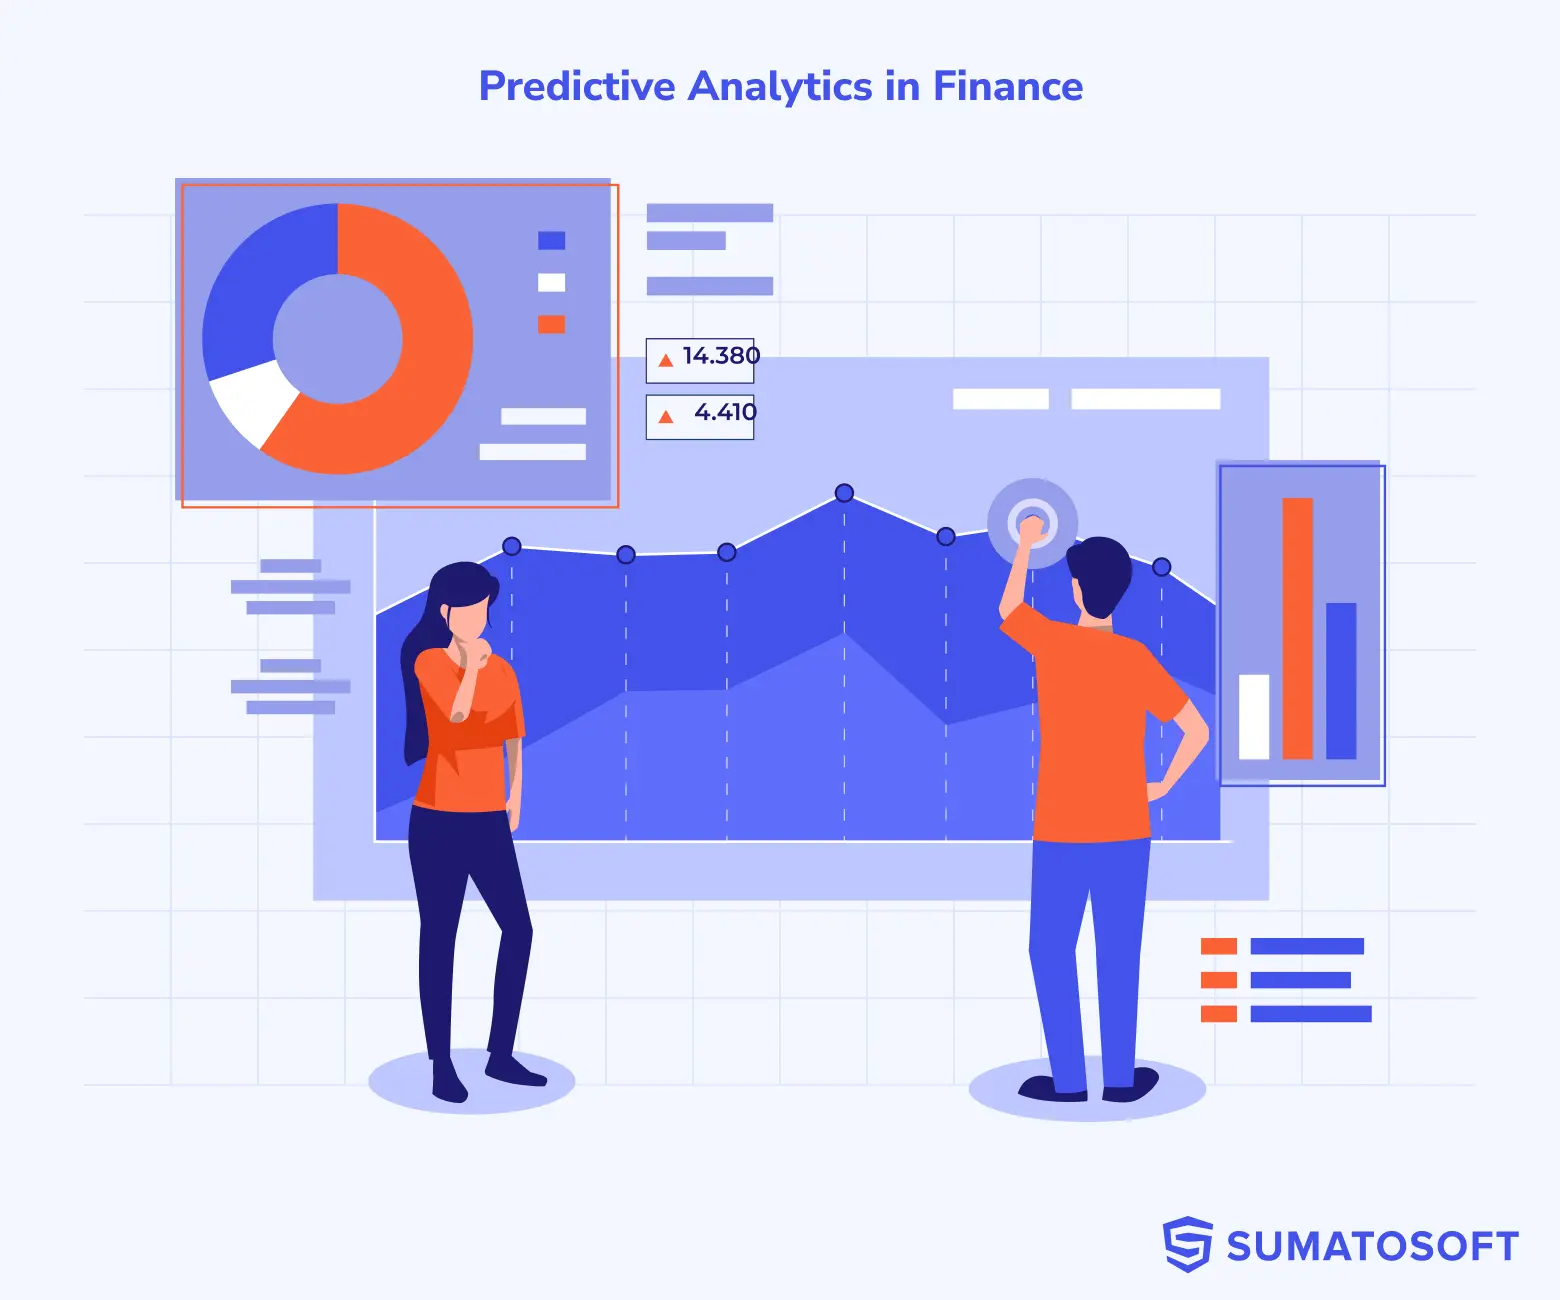
Predictive Analytics – Credit Risk & Churn Modeling
Developed machine learning models including Random Forest, SVM, XGBoost, and LSTM to predict credit risk and customer churn. Achieved over 95% accuracy and applied SHAP for model interpretability. Followed CRISP-DM methodology throughout.
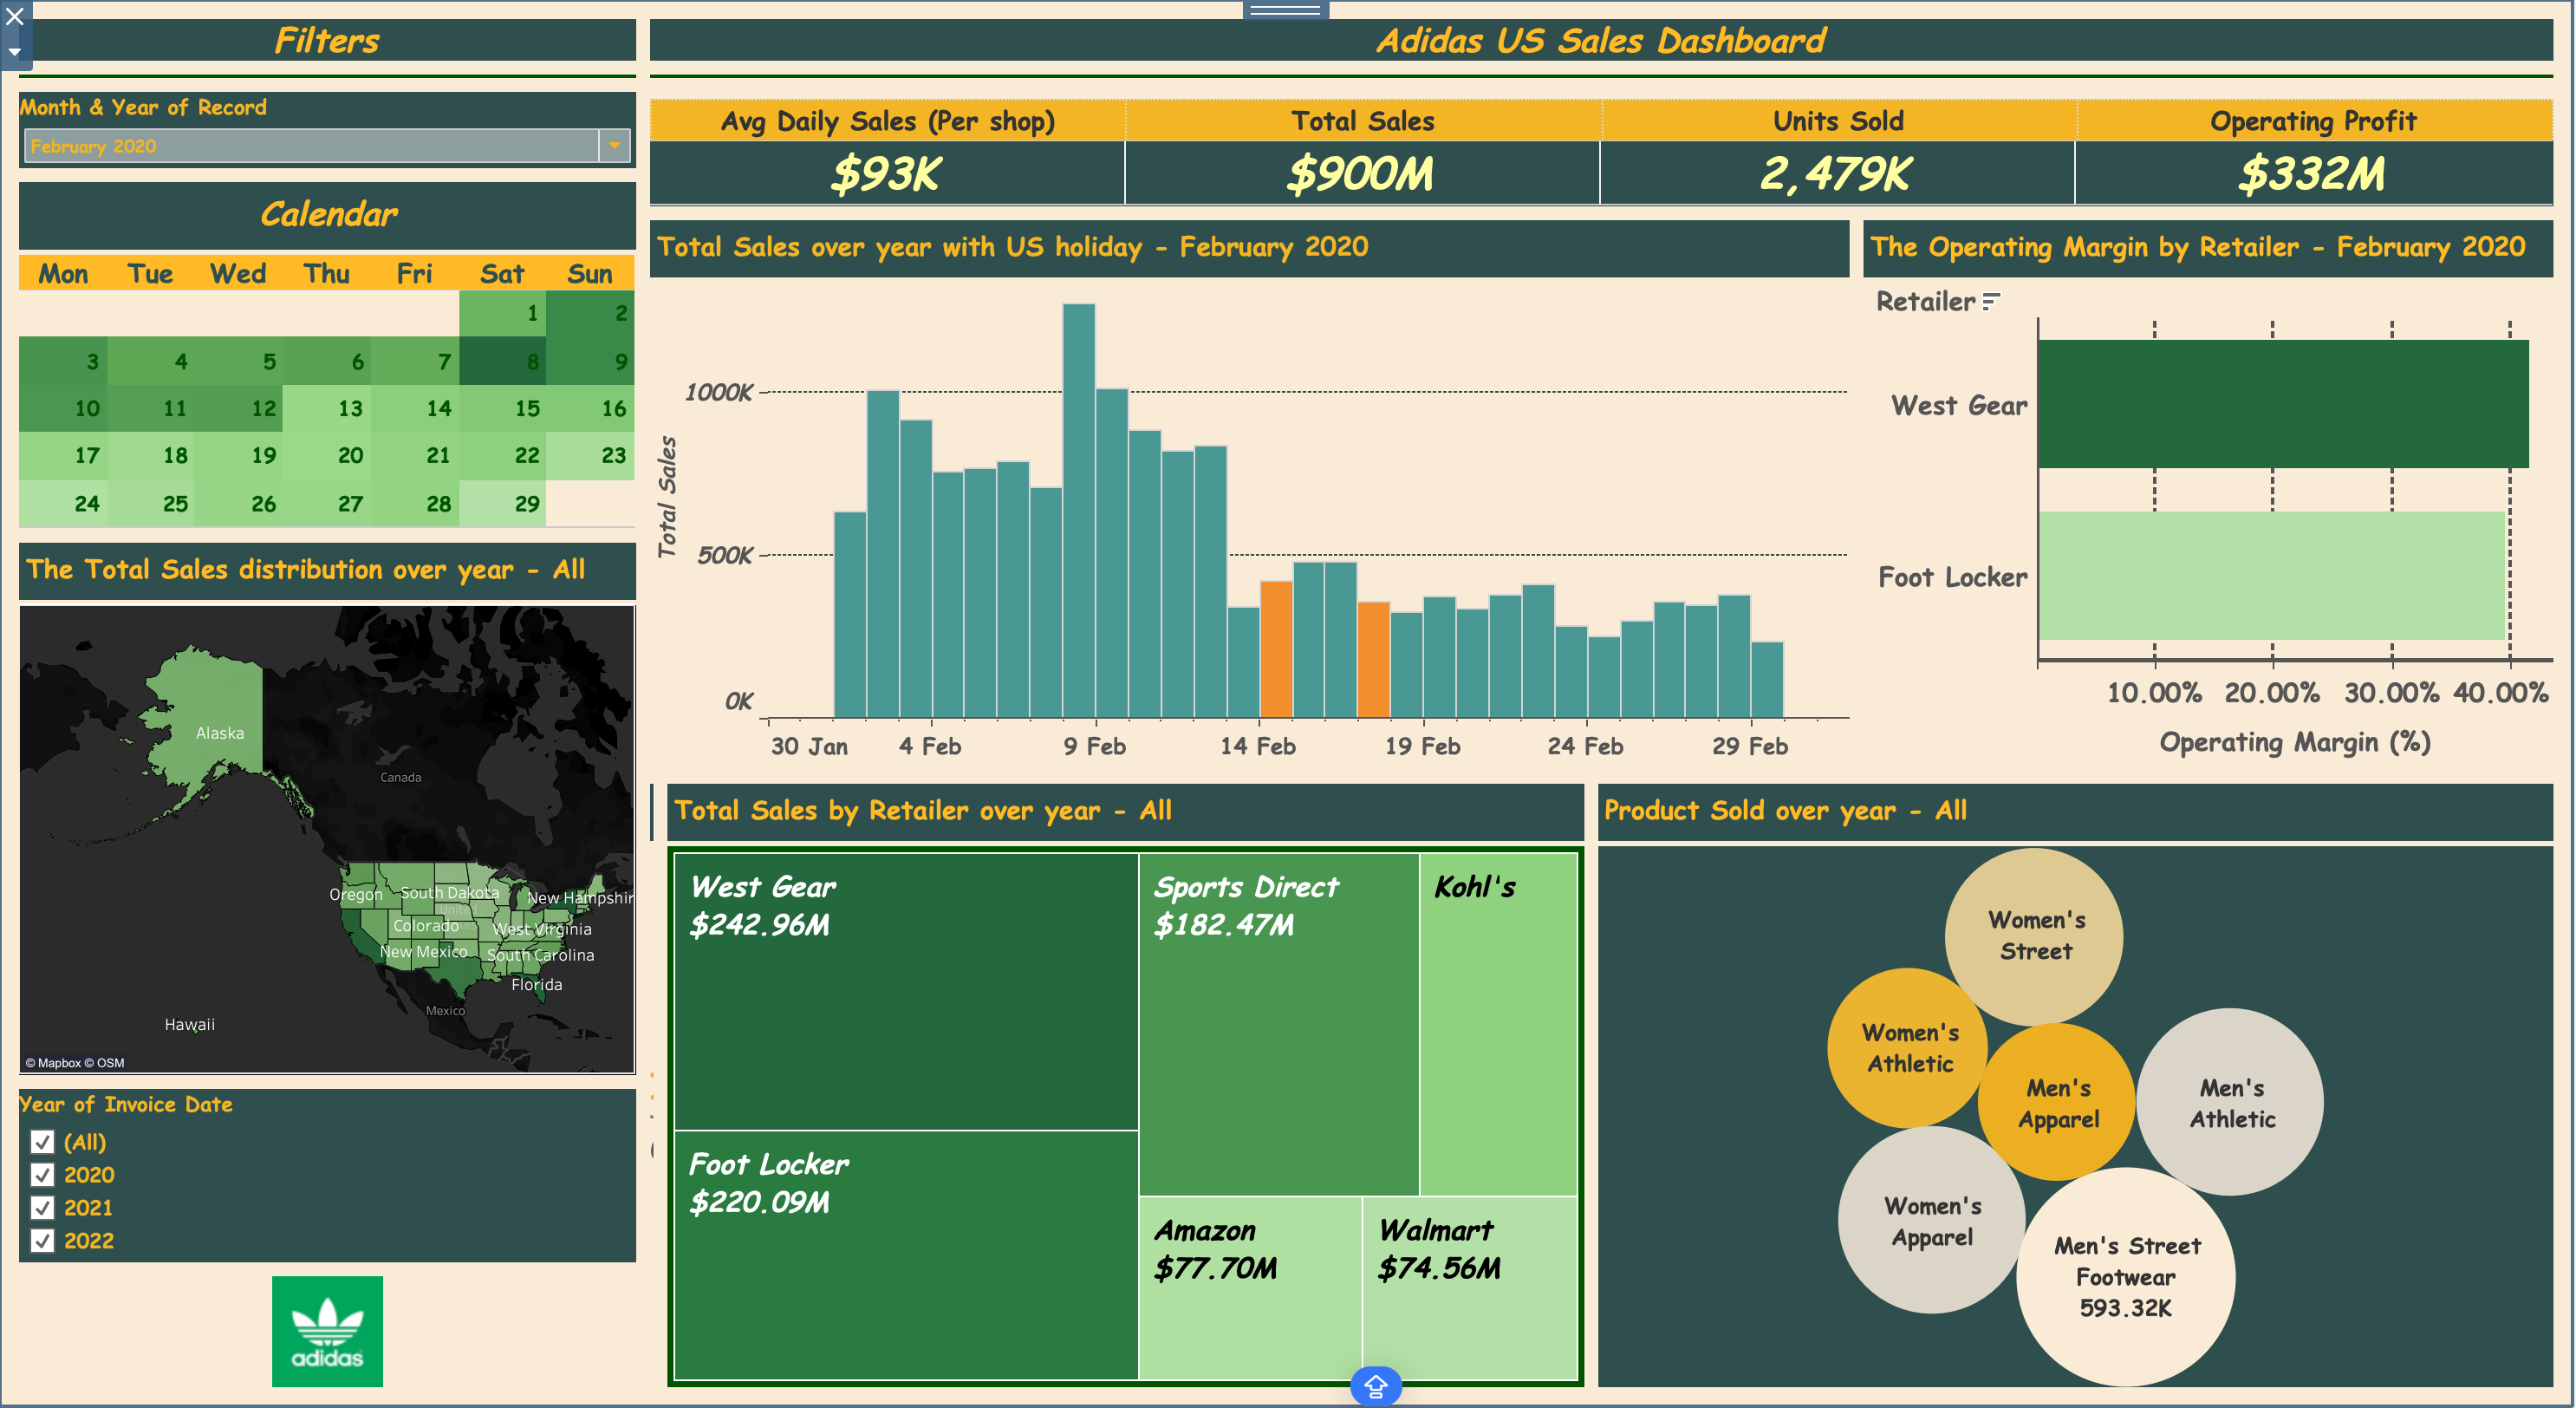
Adidas US Sales Dashboard
Built an interactive sales performance dashboard using Tableau to analyze Adidas's US market data. Visualized KPIs such as total sales, operating profit, daily sales trends, and product performance. Included map-based and holiday-based filters to enable detailed geographic and temporal analysis.
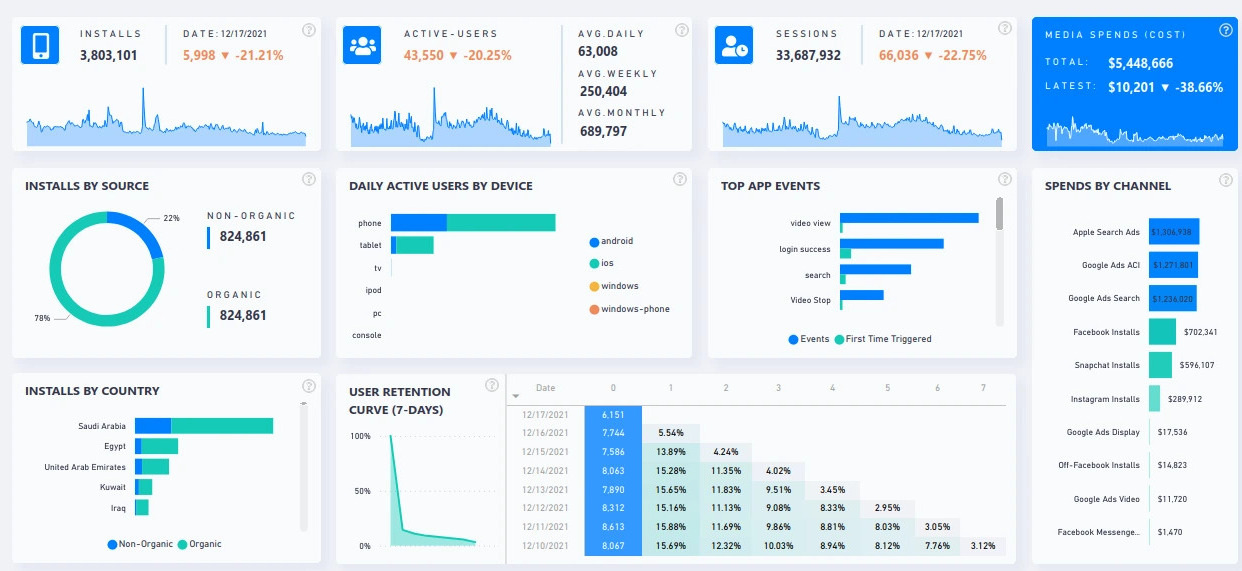
Mobile App Performance Dashboard
Designed a detailed app performance analytics dashboard in Power BI. Tracked installs, sessions, retention, and user engagement by device, country, and source. Included cost analysis by ad channels and key metrics like DAU, WAU, and MAU for marketing and product teams.